Calculate automatically OEE – SPC – KPI
We can help you determine the OEE indicator for your plant! SEE HOW >>
OEE INDICATOR – DISCOVER THE POTENTIAL OF YOUR PLANT!
Production plants have data on the time needed to perform a given operation. Moreover, they are aware of the improvements that have been made recently. An example would be the time it takes to produce a specific part. Most manufacturers have access to such data.
On the other hand most manufacturers do not have access to knowledge about the real impact of variability in individual tasks on the overall processes in the plant. If one factor influencing the process is improved, such as automation, how much does this affect overall performance? In the context of industrial automation, the question posed is very important. The possibilities of automating the production process are constantly expanded with new solutions. Today, wide access to automation, both on the hardware and software side, has become a matter of course. These automation tools help to link the processes together. They allow for a trouble-free flow of tasks in the plant without undesirable disturbances while reducing the need for employee intervention. Manufacturers evaluating the automation process must be able to analyze the entire enterprise.
Manufacturers need an indicator that will allow them to measure overall performance. Indicator allowing the assessment of the improvement process is OEE (Overall Equipment Effectiveness).
WHAT IS OEE?
OEE is a key KPI (Key Performance Indicator) that describes the effectiveness of the equipment installed in the enterprise.
OEE consists of three components, each of these components having two main problem areas. The mentioned elements are:
Availability – expressed as a percentage of the operational time to the planned production time. It should be added that the planned downtime is not included in the planned production time, therefore the availability only shows the use of the planned production time. Problems that reduce the availability rate from 100% are hardware failures and retooling.
Efficiency – indicates how much time is needed to produce a specific number of goods. Efficiency is the ratio of net operating time to operating time, expressed as a percentage. In other words, it describes how much of planned number of items was produced within a certain time period. Performance issues are speed limits and minor downtime.
Quality – number of good-quality products in relation to the total number of goods produced. In other words, it is the ratio of effective production to net operating time expressed as a percentage. Problems that lower the quality index are installation efficiency and production efficiency. Efficiency of the installation is related to errors made at an early stage, e.g. wrong location of the installation. In turn, the production efficiency is related to errors that appear in the production process, e.g. errors occurring as a result of tool wear.
OEE = Availability x Efficiency x Quality
Why is OEE important? The automated production process includes many types of automation relating to the various OEE components. The new approach to industrial automation leads to perception of the higher value of OEE as the goal of the business, and not only as one of the elements of improvement.
How to use intelligent data analysis? An important issue related to implementation of the system is cost of its installation. With the solutions outlined above, the installation cost is relatively low compared to the potential benefits that can be achieved. Instead of purchasing new, more efficient machines, you can achieve the same effect by introducing a system that will allow you to fully use your production capacity. Thanks to the implementation of such solution, the production capacity previously allocated to loss will be fully used. OEE allows for greater transparency of income as it describes what proportion of the potential production efficiency generates profits. The increase in OEE indicates what potential profits can be generated. All you need is a simple action of multiplying the sales volume, gross margin and the percentage increase in OEE. The result of this action is additional profit. Information automation not only saves time, but also reveals where time is wasted. By using the simple operation mentioned earlier, the manufacturer can see how valuable it is to identify the full capacity of the plant.
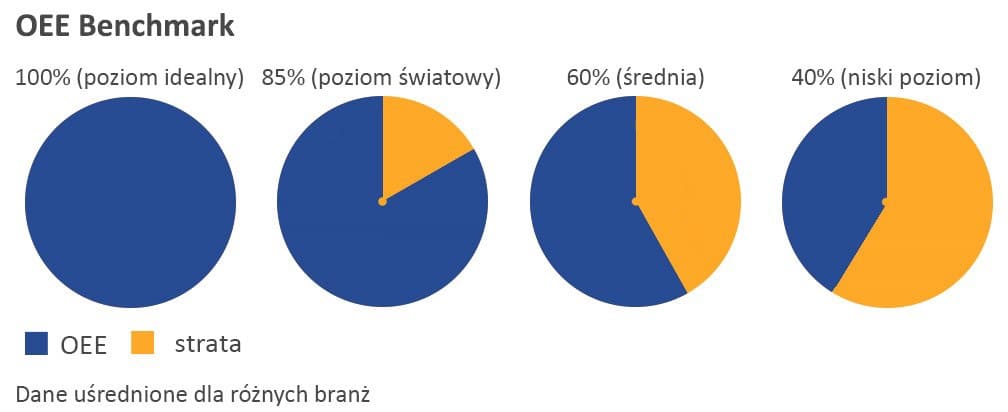
World-class OEE. The indicator captures so much process information that its value can be surprisingly low. A world-class manufacturer can achieve an OEE of 85%. A perfect manufacturer can achieve the aforementioned ratio of 70%. A relatively good manufacturer achieves an OEE of 50%. As can be seen from the mentioned data, OEE shows a large potential of unused production capacity.
| World class level | |
| Availability Operational time/Planned production time |
90,0% |
| Efficiency Net operating time/Operating time |
95,0% |
| Quality Effective production/Net operating time |
99,9% |
| OEE Availability x Efficiency x Quality |
85,4% |
GE DIGITAL MES CLASS SOLUTIONS OFFER A COMPREHENSIVE RANGE OF THEMES RELATED TO THE OEE PERFORMANCE COEFFICIENTS (AS WELL AS ANY OF THEIR MUTATIONS)
Modules monitoring production efficiency enable better use of the company’s capital through the use of comparative analyzes using data on the efficiency of the entire process (KPIs, eg OEE). With the ability to identify and monitor areas for improvement, GE’s MES / MOM solutions are an ideal solution for managers seeking to increase production efficiency – without the need to invest in additional equipment, people or increase material costs.
OEE ANALYSIS:
OEE analysis allows to determine the current efficiency of machines and devices and to show where losses that reduce efficiency occur. In order to know what the current situation is, it must be measured. Only then you can seek to efficiently improve the efficiency of the production line.
GE software supports production processes in terms of production efficiency in the following aspects:
- Automatic tracking and saving of production events (Downtime, Waste, Production Count)
- KPI calculations based on Down-time and Waste data
- Associating production events with devices
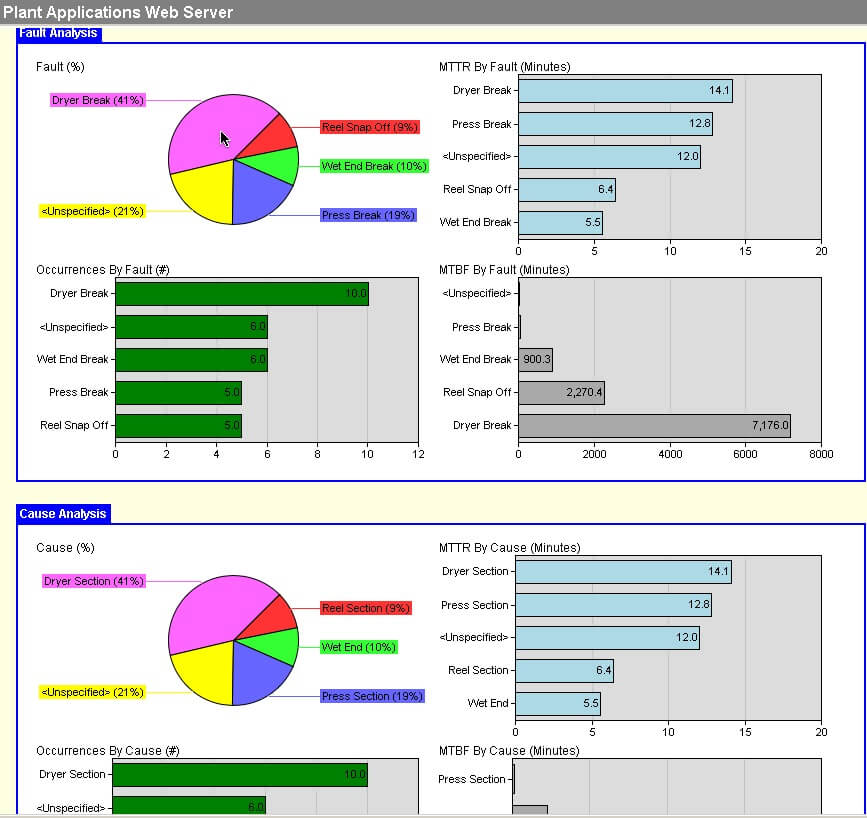
- Monitoring the causes of production events
- Measure of OEE production efficiency
- Possibility of modeling any efficiency calculations and defining the coefficients in accordance with those previously used in a given production plant.
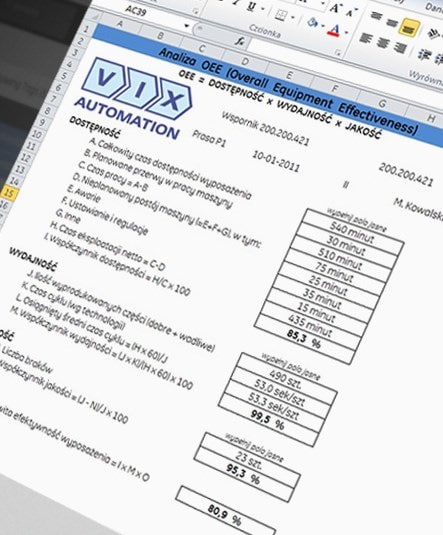
OEE can be calculated manually…
Manual calculations leads to distortions, and information on production efficiency is often not the case!
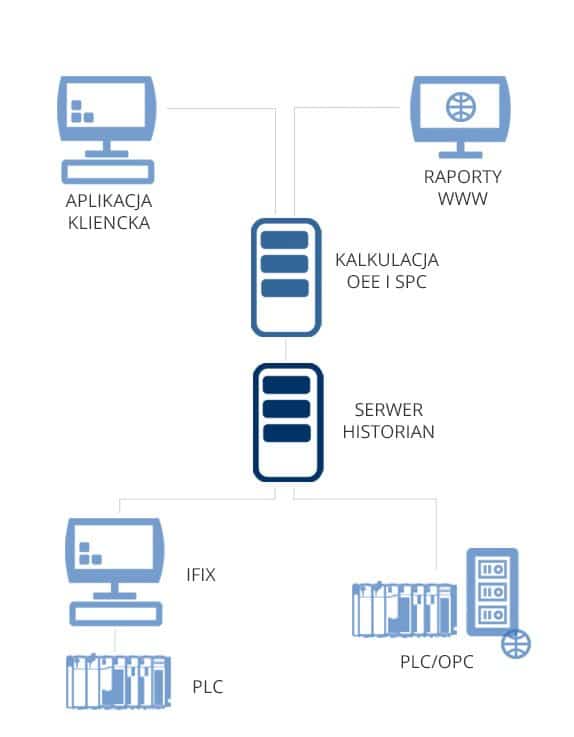
…or automatically.
Every second counts! 1 second can make a big difference from a financial point of view. It is not possible to parse events with a duration equal to seconds with manual methods.
Why is it worth monitoring performance with GE Digital solutions?
- quick return on investment
- additional profit for the enterprise
- extensive list of reference implementations: 600 implementations worldwide, 35 countries, 15 major industries
Examples of references in numbers:
- Nissan – Increased production – additional 8 cars per day
- InBev – Increase in total line efficiency, more than 5% increase in overall production, 90% reduction in packaging losses
- Gumlink – OEE increase from 50% to 60% after installation
HOW TO PERFORM AN ANALYSIS OF OEE
To calculate the OEE indicator, perform the following steps:
A) Specify the total production time (e.g. 2 shifts per day, work 7 days a week)
B) Determine the planned production time (analysis of planned downtime)
Planned downtime may include such events as: lunch time breaks, training, planned equipment maintenance, service, no orders from customers.
Planned production time is obtained by subtracting planned downtime from total production time:
Planned production time= total production time-planned downtime
C) Perform an efficiency loss analysis:
The efficiency loss analysis takes into account 6 main parameters that influence it. They can be divided into three categories:
- production downtime,
- lower speed,
- quality problems.
Such a division makes it possible to analyze production losses. The table below presents some examples of production events with which given types of losses are most often associated.
| Loss | Type | Example |
| Breakdowns | downtime |
|
| Settings and changeovers | downtime |
|
| Minor downtime | speed loss |
|
| Lower speed | speed loss |
|
| Waste during start-up | quality loss |
|
| Production waste | quality loss |
|
D) Determining availability index:
The availability indicator takes into account all unplanned downtimes, including those related to the lack of materials at the entrance, machine changeovers, or simply unplanned breakdowns.
After subtracting total duration of failures, downtimes and unplanned events from the planned production time, we get the operating time.
E) Determining the efficiency index:
The efficiency index is calculated taking into account the speed losses, i.e. machine operation below its nominal capacity for a given product.
If we subtract the speed losses from the operating time, then we get the net operating time.
The efficency index is the quotient of net operating time divided by operating time.
The quality index takes into account losses related to the production of products that do not meet the quality parameters. It also takes into account scrap and rejects from the manufacturing process.
By subtracting low quality products losses from net operating time we get efficient production time
The quality index is determined by dividing the obtained net operating time by the planned production time
Example of calculating OEE indicator
Input data:
One shift – 8 hours or 480 minutes (total production time)
Lunch break – 20 minutes
Total failure time measured – 30 minutes
The nominal capacity of the machine – 30 pieces / minute
Speed loss – 40 minutes
Waste – 420 pieces
Scheme of solving the task:
Determination of the planned production time:
working time (shift length) – planned downtime (meal break)
planned production time = 480 min. – 20 min. = 460 min.
Establishing the operating time:
planned production time – unplanned downtime (machine failure)
operating time = 460 min. – 30 minutes. = 430 min.
Determining the availability indicator:
operating time / planned production time
availability = 430 min. / 460 min. = 93.5%
Determining speed loss:
runtime at lower efficiency x reduced efficiency
speed loss = 40 min. x 50% = 20min.
Running at 50% capacity is the equivalent of running at peak capacity half the time and downtime rest of the time.
Net operating time calculation:
operating time – speed losses
430 min. – 20 min. = 410 min.
Efficiency index calculation:
net operational time / operational time
efficiency = 410 min. / 430 min. = 95.3%
Determination of quality losses:
number of defects/efficency
quality losses = 420 pcs. / 30 pcs / min. = 14 min.
Determination of effective production time:
net operating time – quality losses
effective production time = 410 min. – 14 min. = 396 min.
Determination of quality index:
effective production time / net operating time
quality = 396 min. / 410 min. = 96.6%
Determination of OEE:
availability x performance x quality
OEE = 93.5% x 95.3% x 96.6% = 86%
RESULT: Overall Equipment Effectiveness for an 8 hour shift in a plant is 86%.