Efficiency Monitoring in MES system
PROFICY PLANT APPLICATIONS – EFFICIENCY MANAGEMENT MODULE
GE’s solutions for production efficiency monitoring help you make better use of your company’s capital through benchmarking that uses data about your overall process efficiency. Thanks to the ability to identify and monitor areas for improvement offered by MES – Manufacturing Execution System, this module is an ideal solution for managers seeking to increase production efficiency – without the need to invest in additional equipment, people or increase material costs. This makes MES systems an efficient and cost effective solution. The basic factor for efficiency monitoring is OEE (Overall Equipment Effectiveness).
PERFORMANCE MONITORING
Before the implementation:
System required entering downtime data into a database (Access) by operators manually. Disadvantage of this system was absorption of service, lower accuracy and no micro-failures registration, e.g. below 5 minutes.
After the implementation:
Thanks to automatic (online) monitoring of machines’ operation, the MES system collects very accurate data on the time and causes of failures, and also provides up-to-date information on the current performance of the line, not only for the management, but also for operators.
KEY FUNCTIONALITIES:
- Tracking and monitoring production and OEE coefficients
- Tracking downtimes and losses, production counting
- Monitoring of downtime, losses, production efficiency and user-defined production events
- Connecting production events with specific causes based on real-time data
- Analysis of machines and devices efficiency based on so-called root cause tree to identify the root of the problem
- Compilation and analysis of data in relation to production events filtered by production units, manufactured products or by staff (in hours, shifts, days) in order to enable various types of improvements
- Linking events and their causes to current production operations (data coming directly from the production line thanks to Proficy Historian – a fast, safe and reliable industrial database)
- Generating reports facilitating decision making
- Browser-based analysis and visualization
- Extensive add-ons for Microsoft Excel
- Scheduling report creation
- Detailed production data for long-term reports.
IMPLEMENTATIONS BENEFITS (EFFICIENCY MODULE):
- Better management of resources (people, equipment, material) thanks to a complete overview of the parameters constituting the components of the OEE coefficient
- Produce more at lower cost!
- Identify and improve the problematic areas
- Minimize planned and unplanned events related to downtime of lines or machines
- Reduce waste and re-manufacturing the products
- Increase machine working time
- Make decisions based on data straight from line to plan the expenses needed to improve an existing solution
- Analyze your production basing on shift, equipment or product on the line
- Link the expenses with the possible profits that should flow from them
EFFICIENCY REPORTING:
The ability to generate reports and statements on a plant-wide scale allows you to make immediate decisions in real time. Various reporting options help to provide reliable information in a clear form – always on time. The openness of the system means that, apart from a number of reports available immediately after the implementation of the solution, the user can build any production data report that meets all his expectations.
Examples of reports presenting aspects related to production efficiency monitoring in solutions based on GE software are presented below.
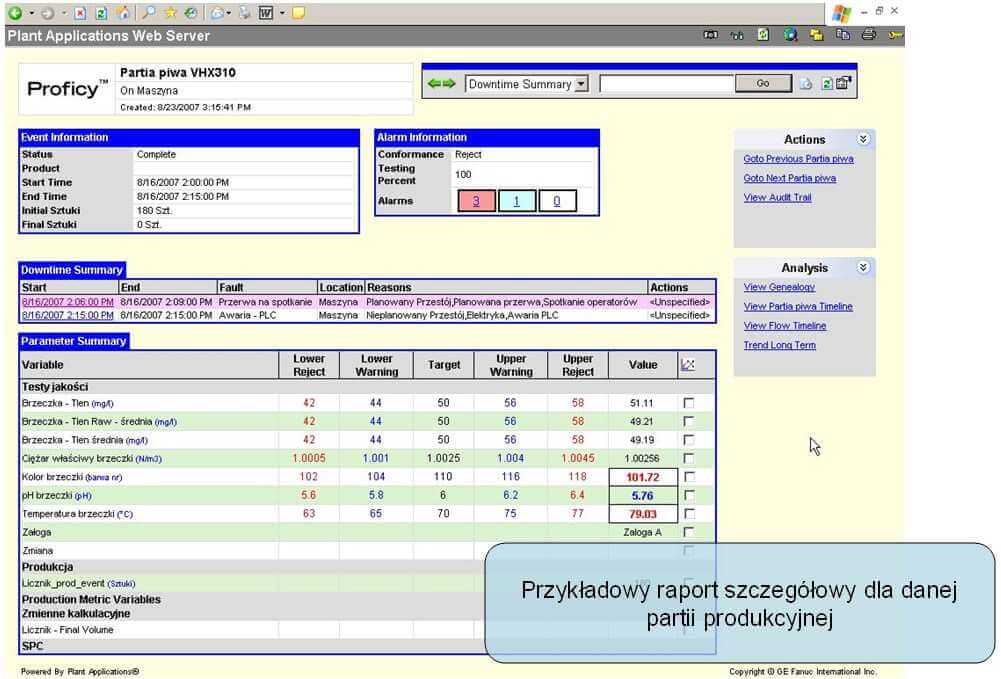
1. Screen of the client application, presenting production parameters in real-time for subsequent batches in the process. It allows the operator to be visually informed about deviations from the declared production specifications, real-time preview of downtime and production losses along with precise information on the cause of the event.
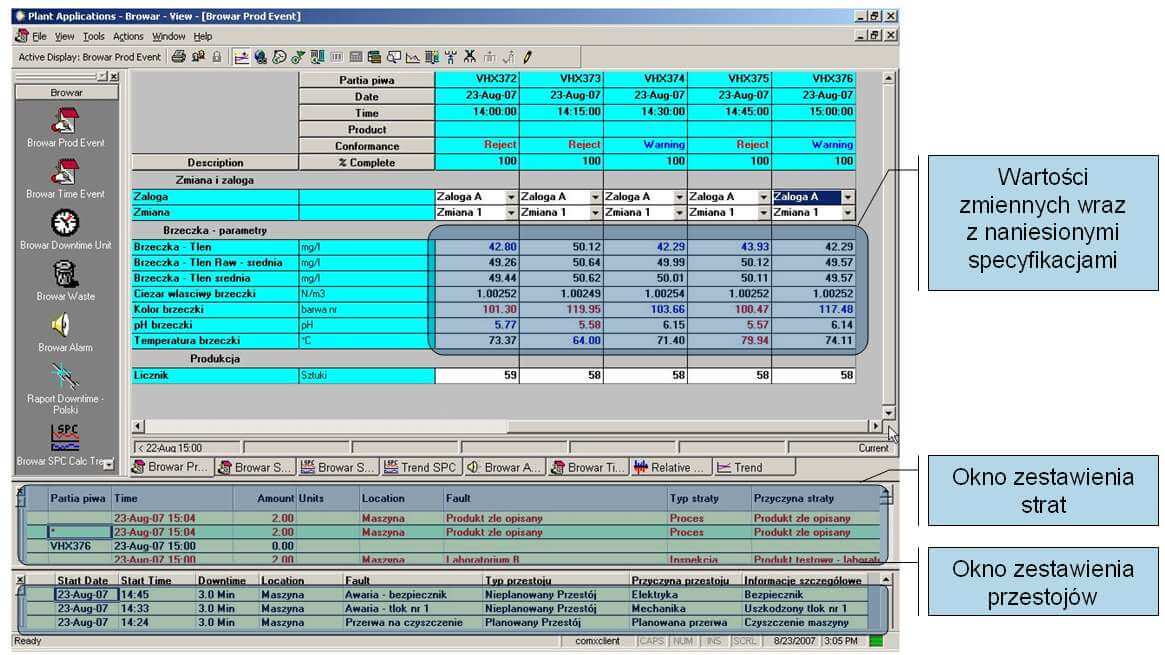
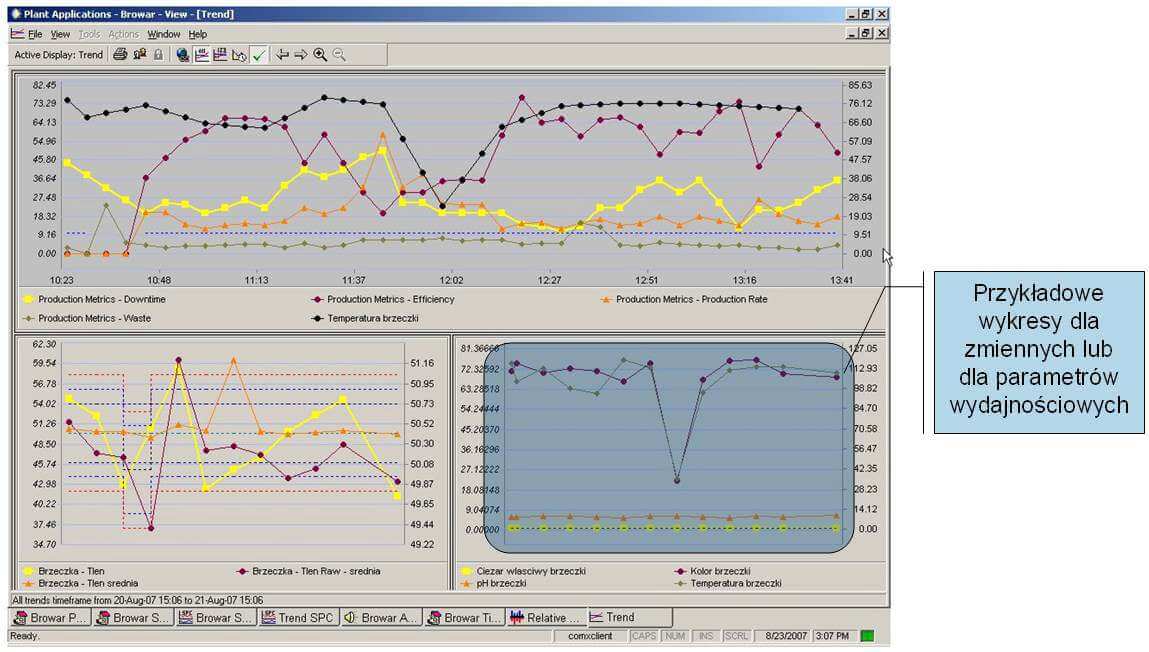
2. Client application screen displaying real-time graphs presenting performance parameters. The graphs may also contain information about the specifications (warning limits) for the efficiency factors, exceeding which triggers an alarm (e.g. a decrease in production efficiency below the assumed level).
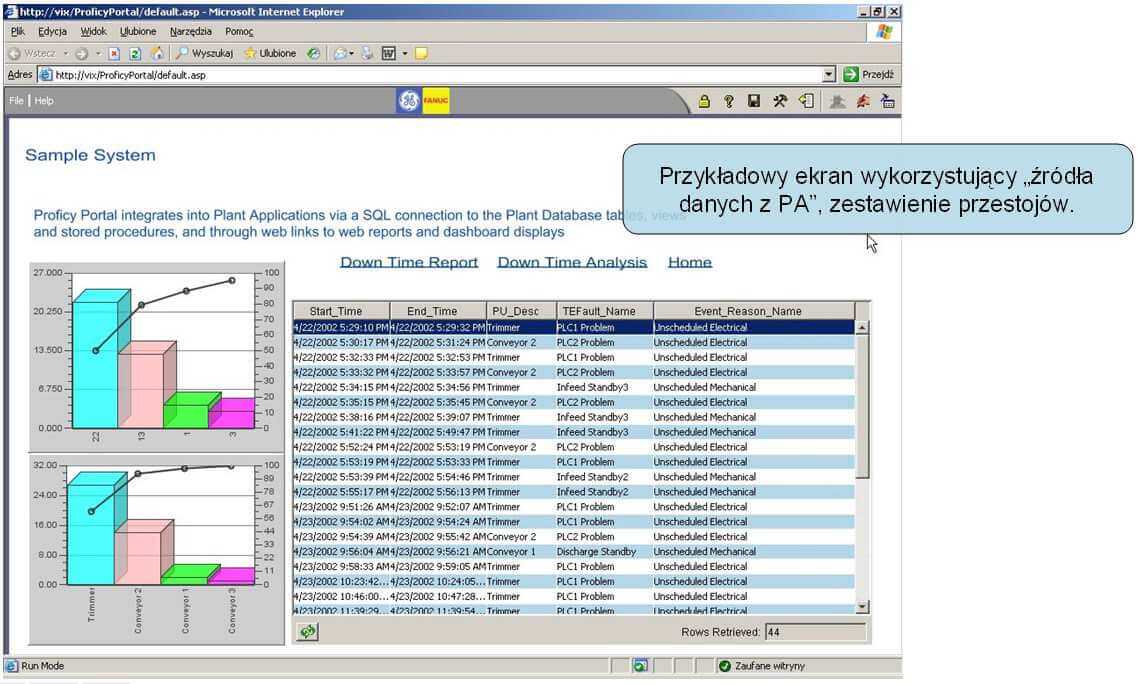
3. List of downtime with detailed parameters about their duration, causes and location of occurrence (which machine, which line). The list can be generated automatically, thus the data is fully reliable, so-called human factor is eliminated and micro-downtime data is also recorded. 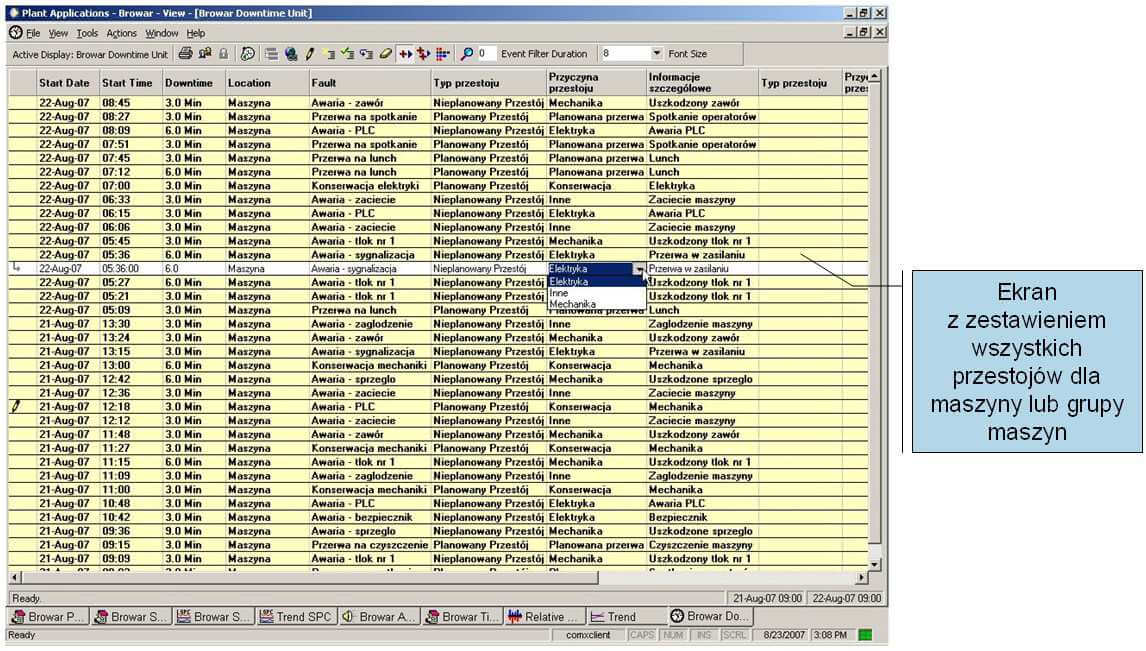
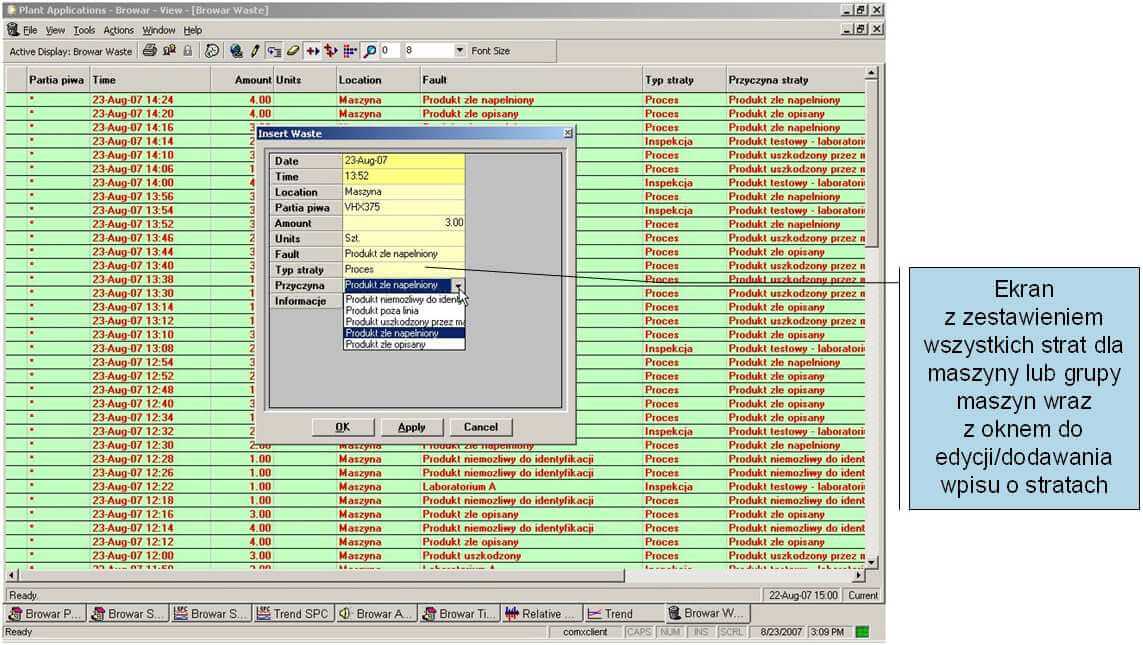
4. A list of production losses, with the cause of loss, the amount of products considered as rejects, etc. As with downtime, the list can be generated automatically or manually. Thanks to this approach, you can have full insight into the operation of the entire production plant from one place, which allows for a quick and precise response in case of an emergency.
5. Production report for a specific production batch. In addition to the presentation of key parameters with control limits (specifications), the user has access to information about downtime and their causes within a given production batch, about alarms, and about production efficiency.
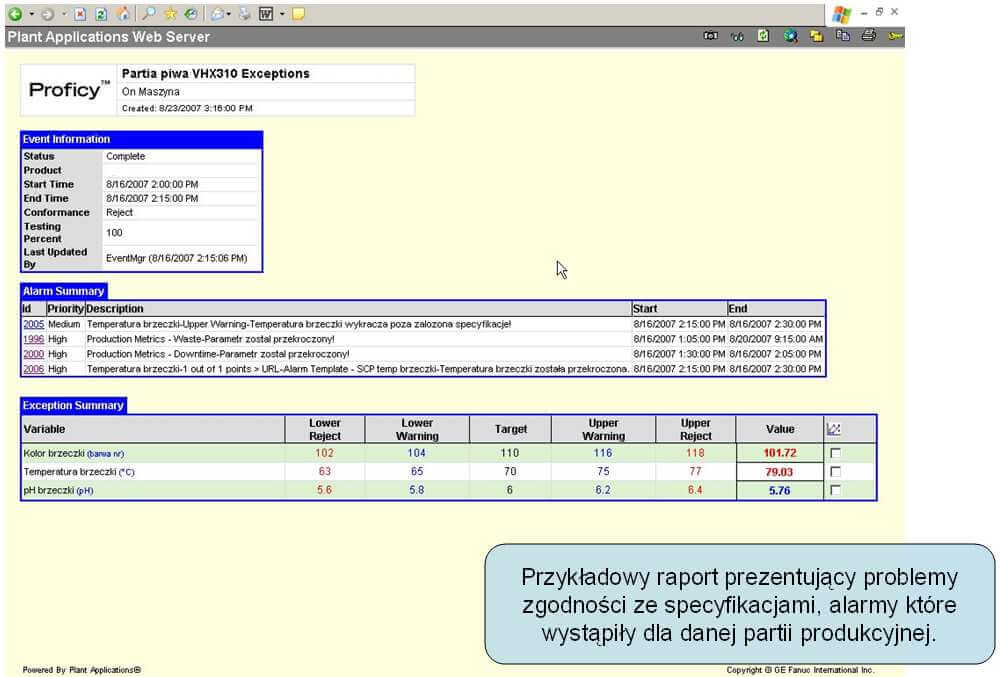
6. Production report presenting a summary of problems in the production of a given batch. Causes of alarms with description, start and end time of the alarm situation, deviations from the assumed specifications.
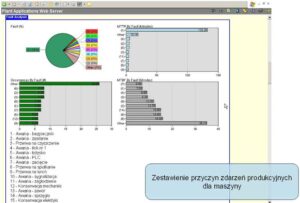
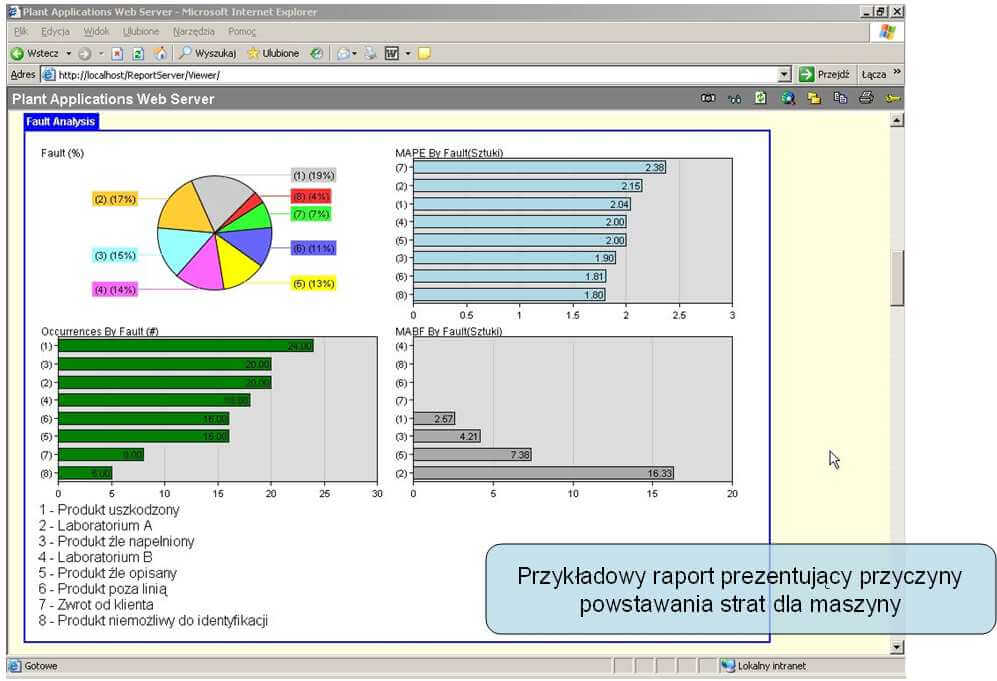
7. A report presenting in the form of a pie chart the most common causes of failure for a given machine for any period of time. The bottleneck can be identified in a simple and legible way. It can be unambiguously determined where problems with production efficiency occur due to downtime.
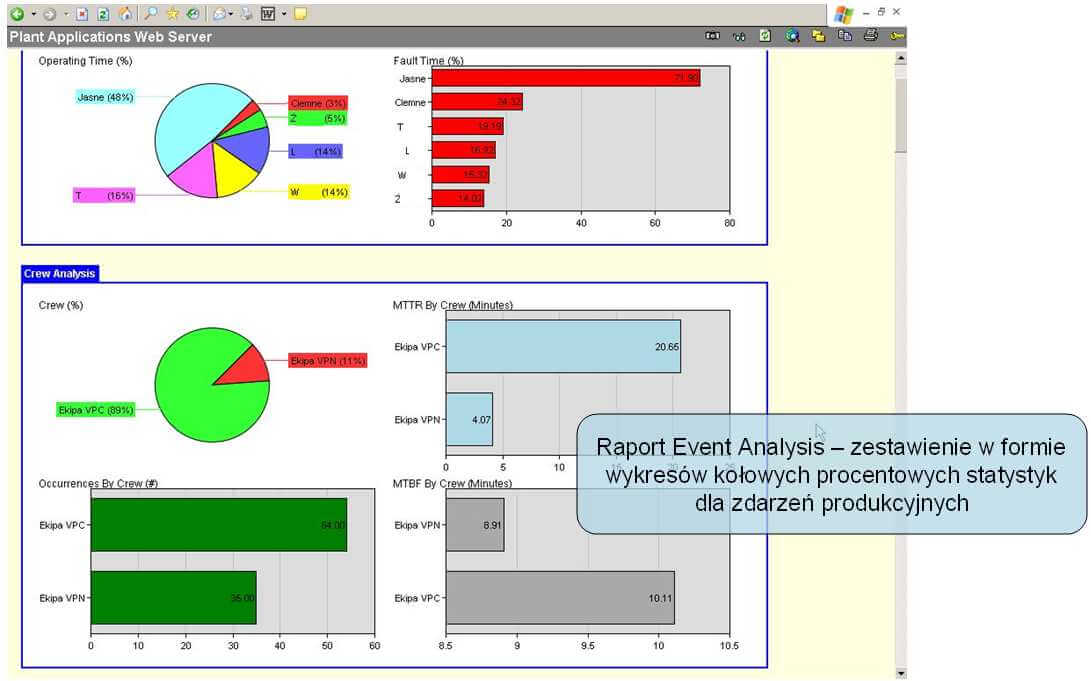
8. A report presenting information about the production (the most frequently produced product in a given period), as well as for which production crew most emergencies generating downtime were recorded. Thanks to such a report, a comparative analysis of the work of individual production shifts becomes possible.
9. A report presenting the causes of losses in the production process. You can clearly define the source of losses and focus efforts on its elimination.
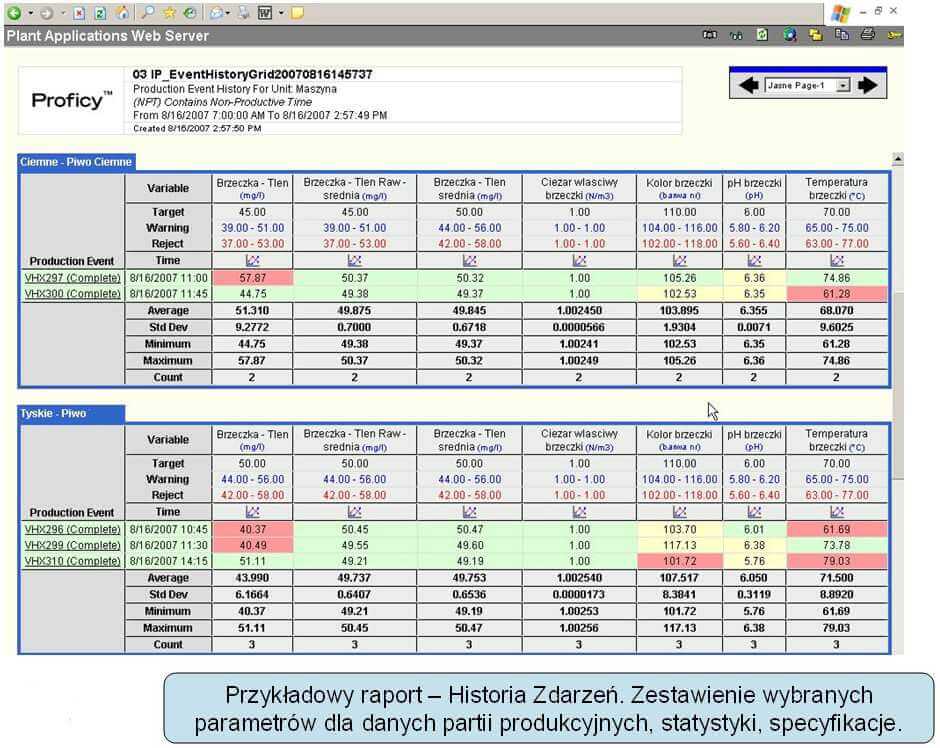
10. Summary of process parameters for subsequent production batches with the division into manufactured products. The report shows compliance with the assumed specifications in the context of specific values.
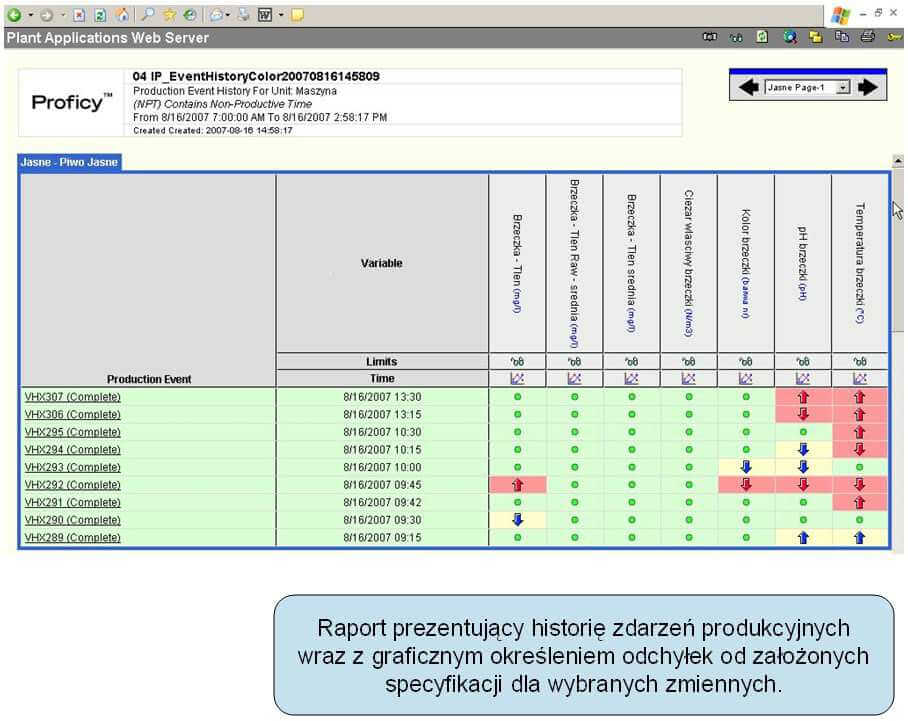
11. Summary of process parameters for subsequent production batches with the division into manufactured products. The report shows compliance with the assumed specifications in the form of icons allowing for an instant assessment of the compliance of the monitored parameters with the assumed boundary conditions.
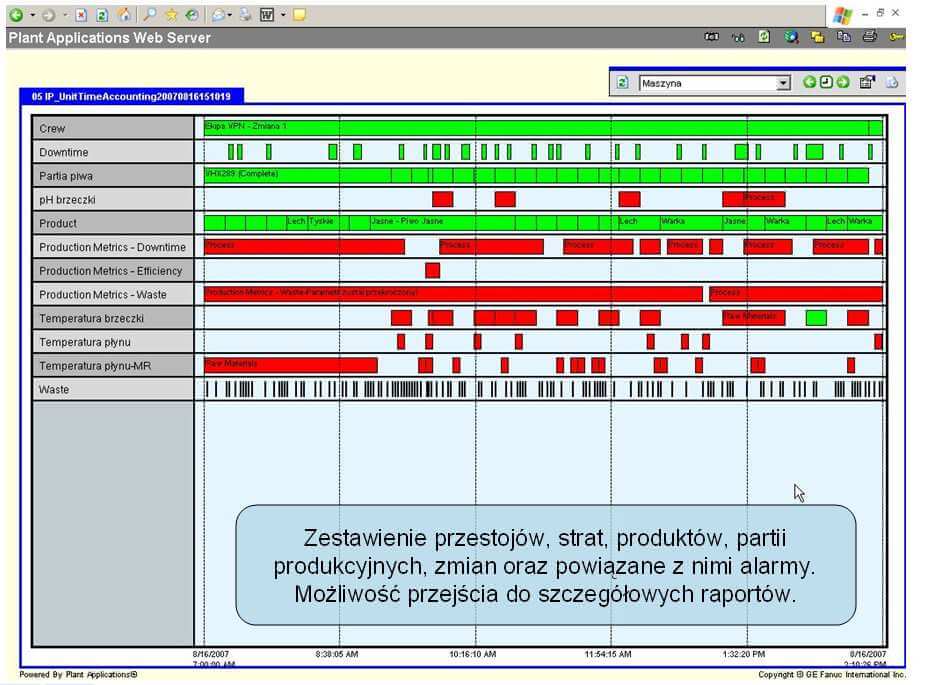
12. A report presenting in the form of a time graph a list of downtimes, losses, subsequent production batches, changes, products, alarms. The number of potential problems in the production process can be assessed in a transparent way, and after identifying interesting events in production – it is possible to obtain detailed information about them with one click.
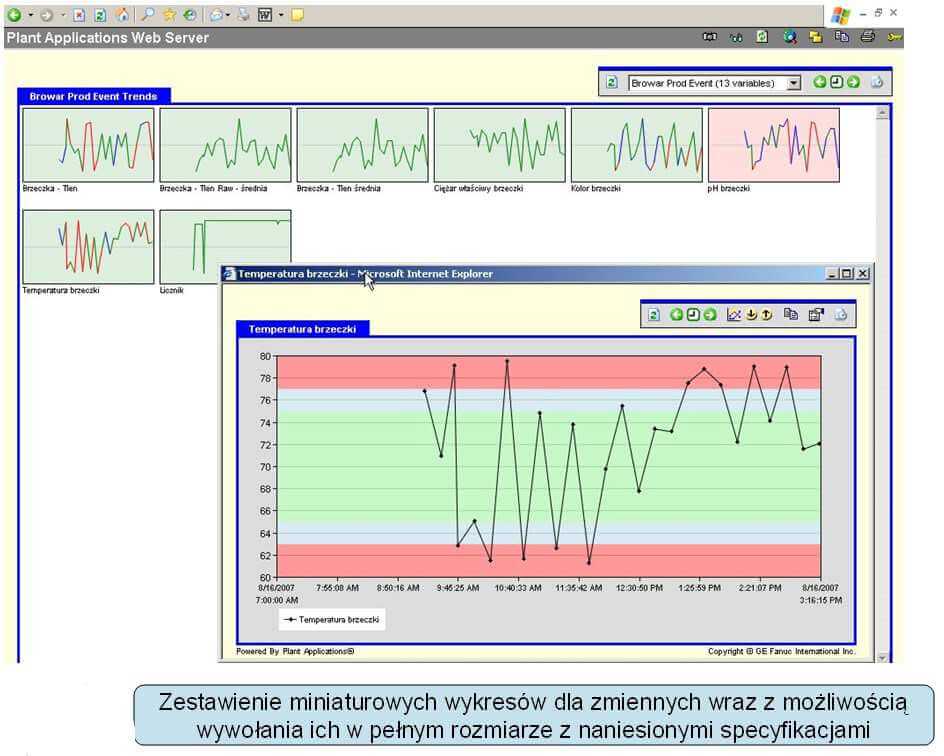
13. Summary in the form of miniature trends graphs of production variables, performance parameters, etc. The colors of the graphs immediately inform about possible problems and deviations from the standards for a given parameter. Each chart can be enlarged and further analyzed.
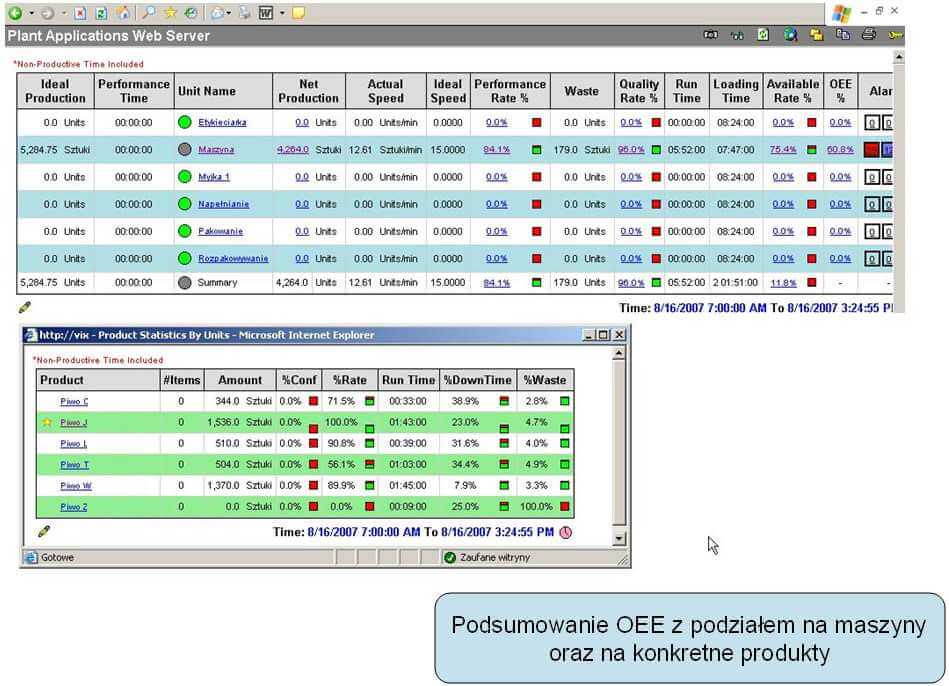
14. A detailed list of performance parameters (e.g. machine availability, losses, quality, downtime, etc.) in tabular form. It is possible to compare a number of machines or products for any period of time in terms of the parameters that make up the OEE calculation. Each key element can be ‘clicked’ for detailed information.
15. The report provides a list of downtime for a given machine and Pareto charts for downtime.
16. List of downtimes for machines with the possibility of selecting any machine from the drop-down list. In this case, the relevant report fields are recalculated and supplemented with the appropriate data. The report also shows the list of downtime causes in the form of bar or pie charts.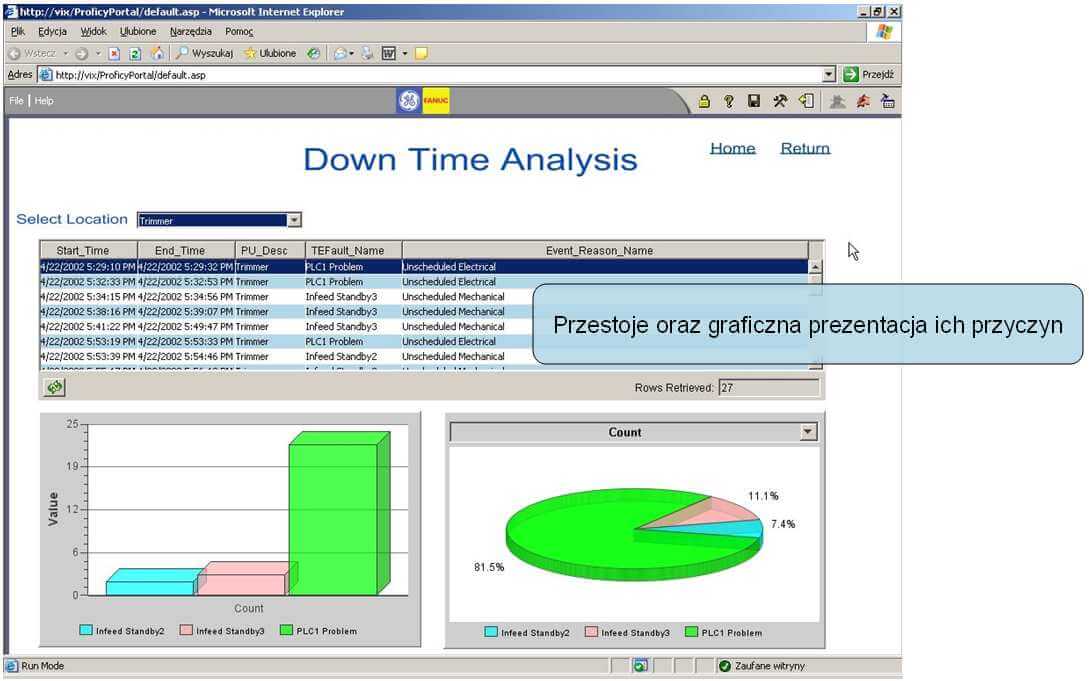
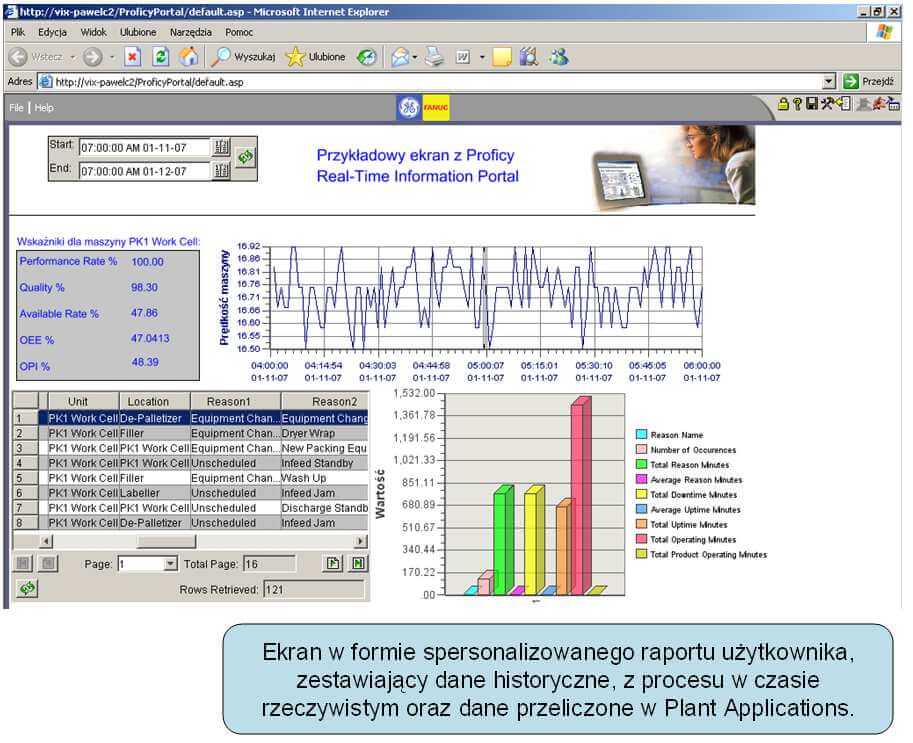
17. Report that allows you to generate a summary of data from multiple sources at the same time. The example below presents live data on performance indicators, historical data in the form of a graph and the causes of downtime from the MES class system in the form of a table and a bar chart.
MORE ABOUT PROFICY PLANT APPLICATIONS >>