Quality monitoring in MES
PROFICY PLANT APPLICATIONS – QUALITY MANAGEMENT MODULE
MES Plant Applications software modules from GE Digital allow for comprehensive monitoring of production quality. As a result, they enable a significant reduction in the amount of production waste and losses in the process. Consistent improvement of production quality affects all its aspects and customer satisfaction with the finished product.
GE solutions significantly improve the company’s efficiency and the financial benefits of production. They are an ideal solution for manufacturers who use the “Six Sigma” methodology in their solutions and other methods aimed at improving the efficiency and quality of the production process.
QUALITY MONITORING:
Before implementation:
Annually, about 8,000 finished beer analyzes were performed. This was a big loss: 300 ml of ready-made beer was required for each analysis, during which much more poured out. In addition, a lot of reagents, dishes and laboratory equipment were used.
After implementation:
The system monitors the parameters of the filtered beer on an ongoing basis. As a result, the number of analyzes in the laboratory dropped from two hundred to several a week. Only verification analyzes are performed at the moment. Once a week, a beer sample is taken from BBT tanks and full analysis and comparison with the results provided by MES are performed.
The issues of optimization and monitoring of production quality in MES class solutions cover 4 basic functional areas:
- Specifications,
- Alerting,
- SPC,
- Compatibility tests
Modules that perform production quality control and reporting tasks allow you to react in real time to events related to production quality. Employees have to take appropriate action only when specifications are exceeded or alarms are triggered according to SPC rules.
KEY CAPABILITIES:
- Real-time information on quality parameters;
- Automatic collection, filtering, counting of quality data;
- Alerting events, also based on SPC rules;
- Support for data collected automatically and manually logged by the operator;
- History management and auditing of any changes for automatically or manually logged data;
- A number of standard reports available immediately after installation of the solution, ability to create user reports;
- Tools for conducting statistical and SPC analyzes available
- The web client uses the data from the module to easily build and display reports;
- Excel Add-in for direct data exchange between GE software and MS Excel for even more detailed analyzes.
IMPLEMENTATION BENEFITS (QUALITY MODULE):
- Production waste and customers complaints reduction;
- Better management of resources (people, equipment, material)
- Alerting when warning states are exceeded: by e-mail or SMS;
- Comparison of production compliance with the assumed specifications;
- High quality of production;
- Reports allowing determine quality indicators for individual changes;
- Quality-time trends, in a form that is easy to analyze;
- Protection, electronic signatures.
QUALITY REPORTING:
The ability to generate reports and statements on a plant-wide scale allows you to make immediate decisions in real time, thanks to the ability to reach the source of the problem. Using of a number of predefined reports or reports made for specific user needs saves time and available resources.
Sample reports presenting aspects related to production quality monitoring in solutions based on GE software.
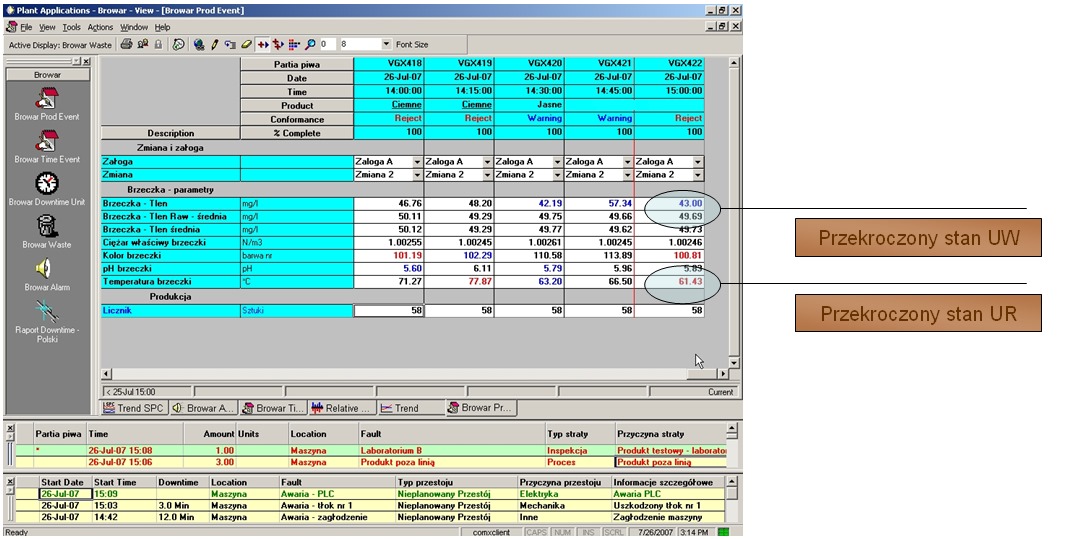
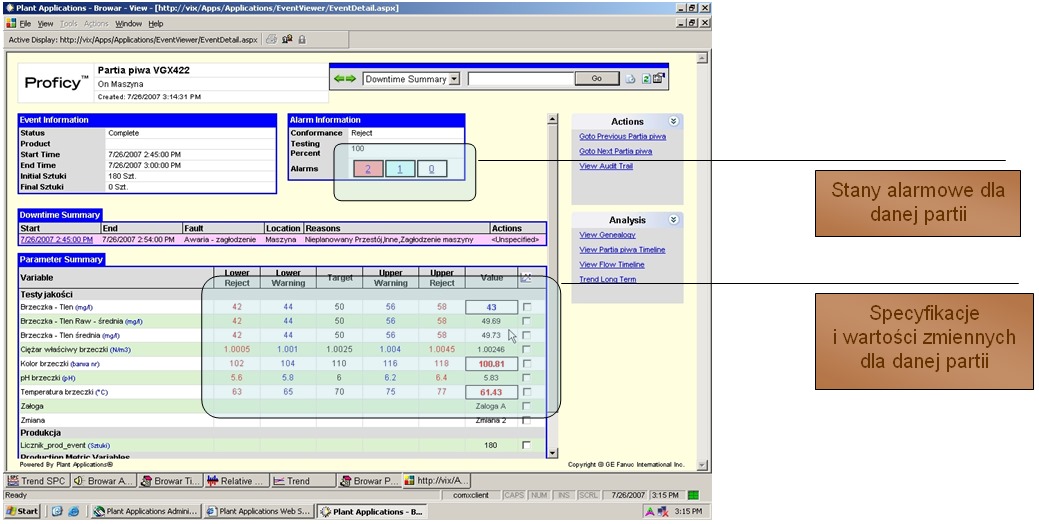
1. Screen of the client application, presenting real-time production parameters for subsequent batches in the process. Operator is visually informed about deviations from the declared production specifications, with real-time preview of downtime and production losses along with precise information on the cause of the event.
2. Report with a summary of production parameters, events (downtime, losses), alarms for a given production batch. The currently valid production specification is clearly presented, it is possible to quickly draw charts for selected parameters.
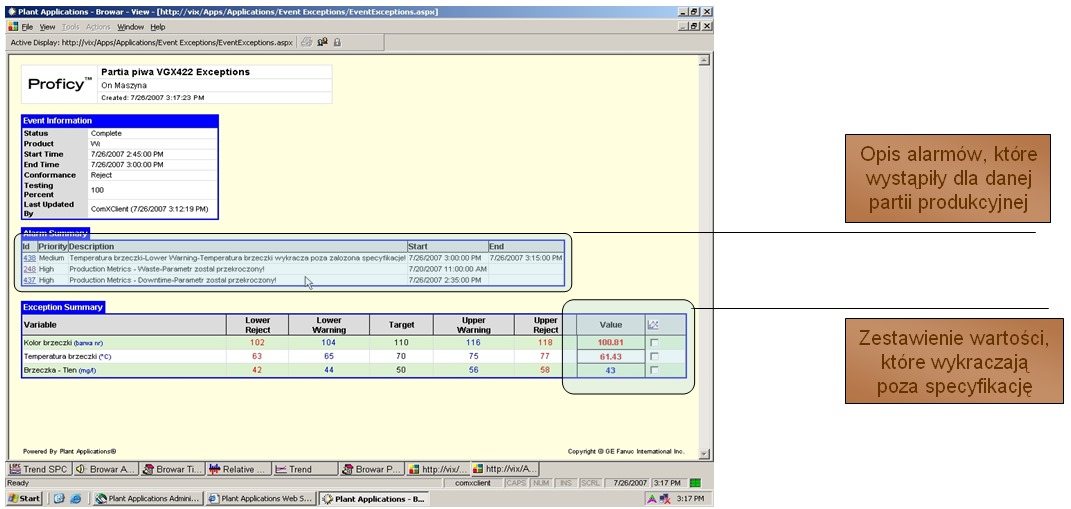
3. Report summarizing quality loss issues in the context of a given batch. Exceeding specifications is clearly presented, the report also presents in detail the causes of alarm situations during production.
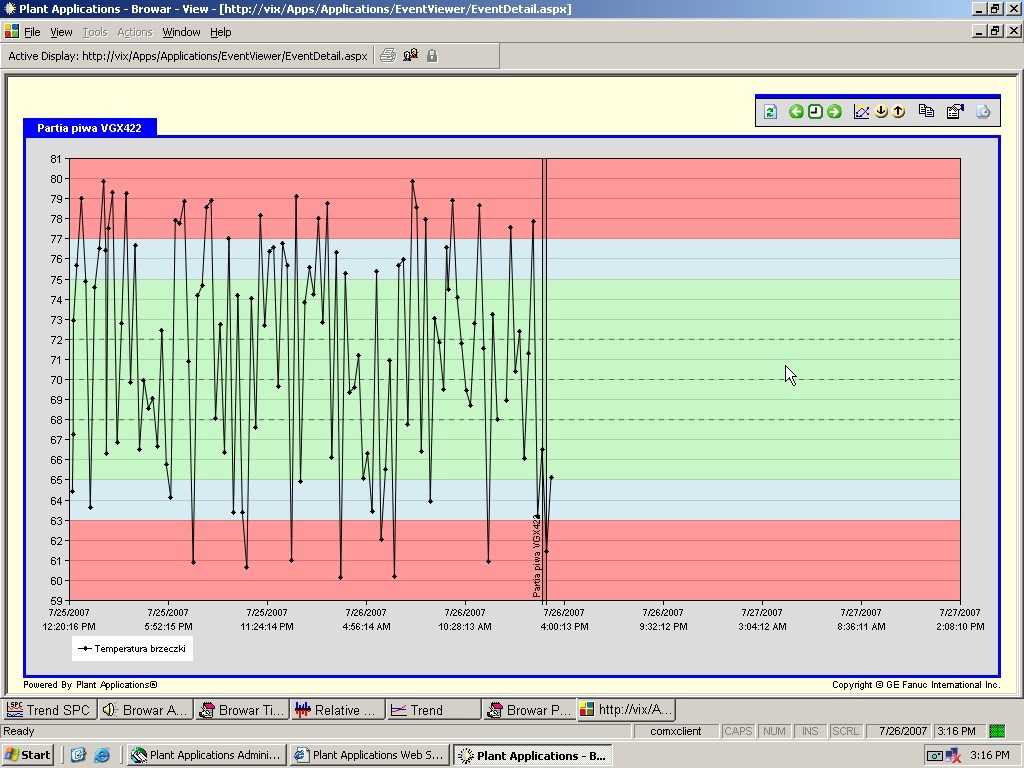
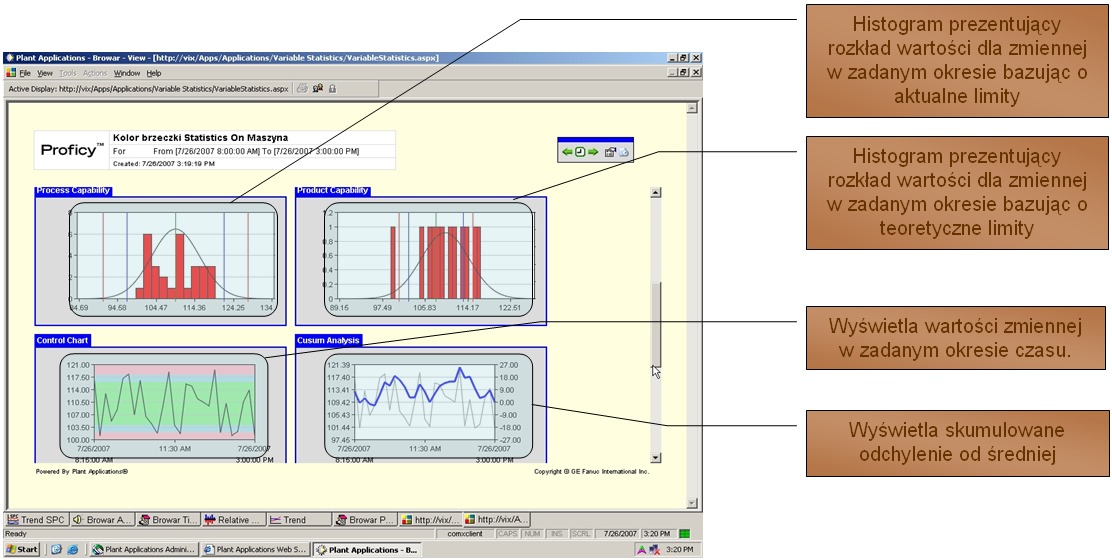
4. Graph for a variable with limits defined in the specification. The chart can also show control limits or a trend. Multiple variables can also be displayed from one trend window
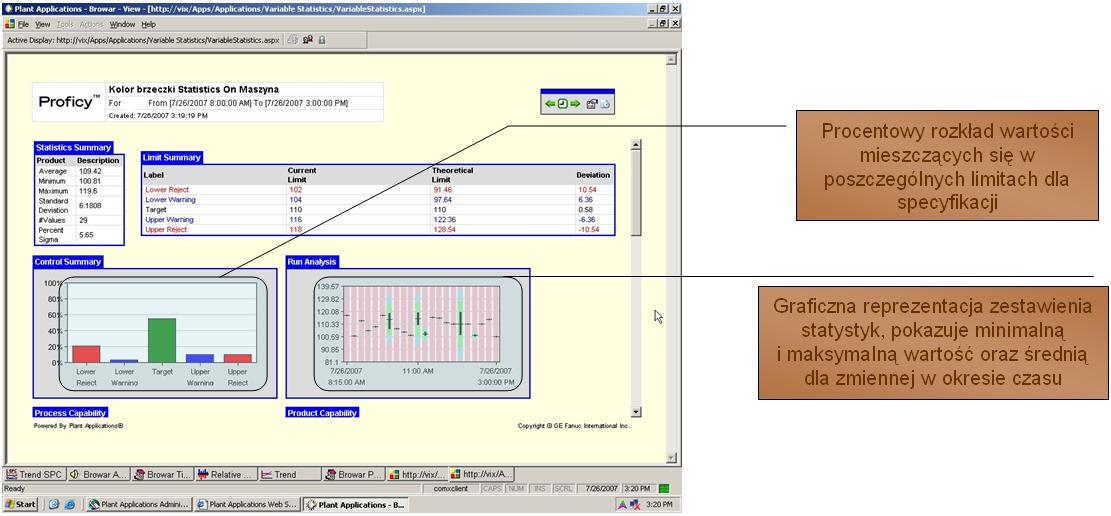
5. Statistical analysis report for the selected production parameter, control limits, specifications, percentage distribution of values, graphical presentation of statistics.
6. Statistical Analysis Report. Histograms, charts, compliance with the production specification (product sheets).
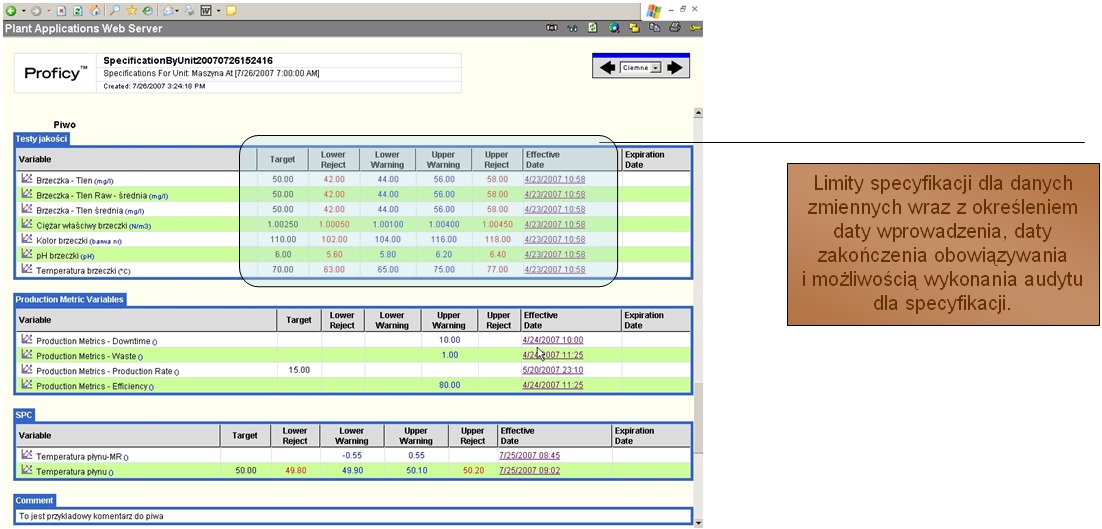
7. Summary of specification limits in the form of a report. It presents, among others, the date of introduction of production limits. Solutions based on the Proficy platform allow you to define the activation time of new technological regimes – it may be, for example, related to the change of the supplier of semi-finished products, where it is necessary to remodel the permissible production limits. Change history is stored for reporting and auditing purposes.
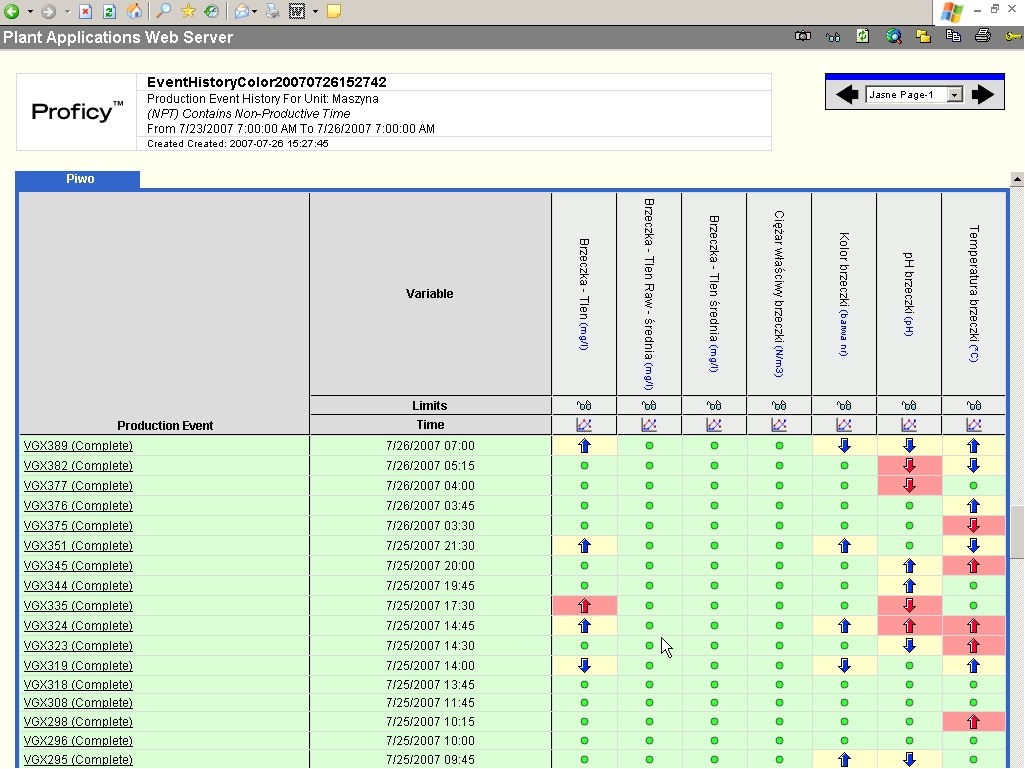
8. Report “visually identifies” the deviations from the assumed specifications for subsequent production batches, in relation to specific variables. Subsequent production batches are segregated in relation to the products that were manufactured, so in a simple and legible way you can read which product generates the most problems and determine their origin.
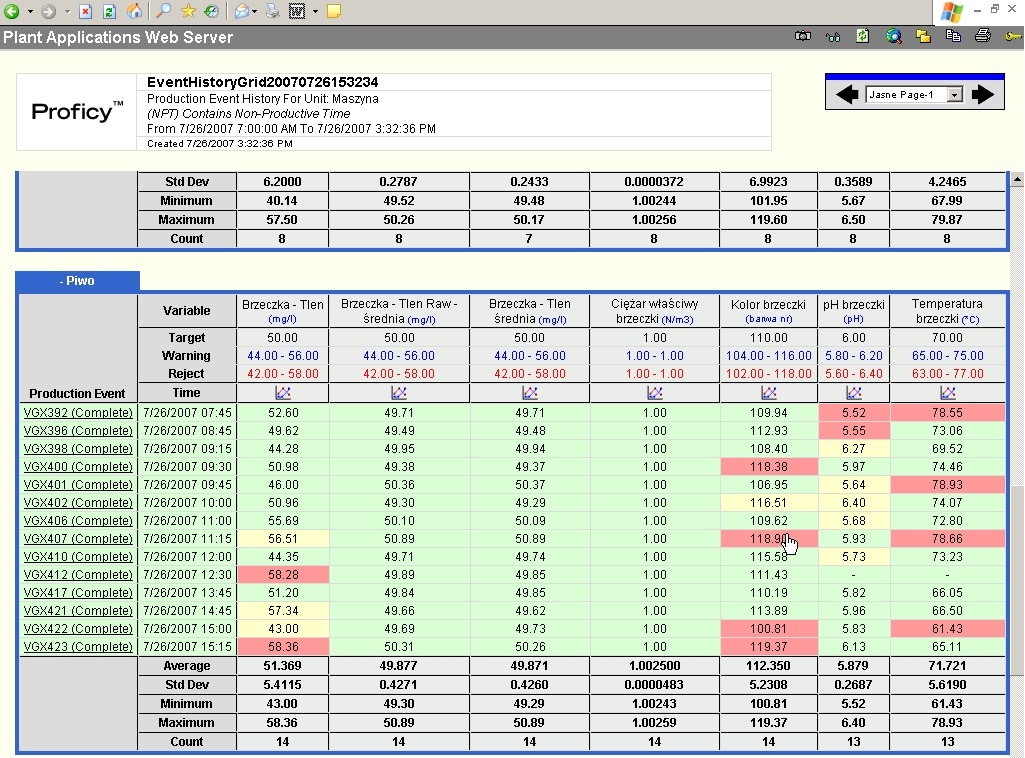
9. Report presenting the values of the variables and deviations from the assumed specifications for subsequent production batches in a given time. The report segregates production data by item production time, which greatly facilitates the analysis and interpretation of data.
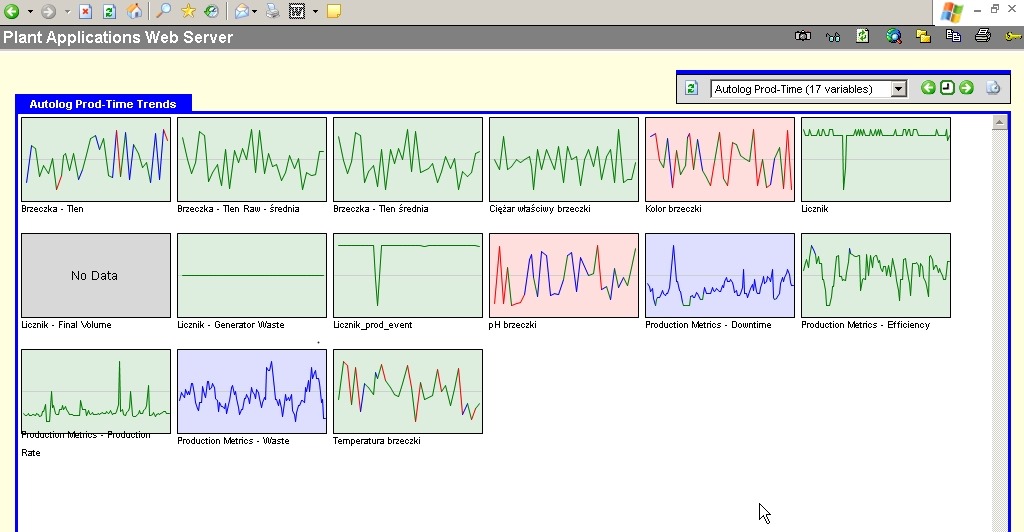
10. Report compiles a series of trends for variables in the form of thumbnails along with their appropriate coloring, depending on the current state of compliance with the specification.
Alarming in MES Plant Applications
- Alarming in Plant Applications is used to document the occurrence of alarms, including their causes and possible actions to be taken. Alarms are presented in real-time, as well as on screens and summary reports,
- Operator can have access to both process and quality alarms,
- Alarms can be automatically sent via email or SMS,
- Alarming applies to both automatically and manually logged data.
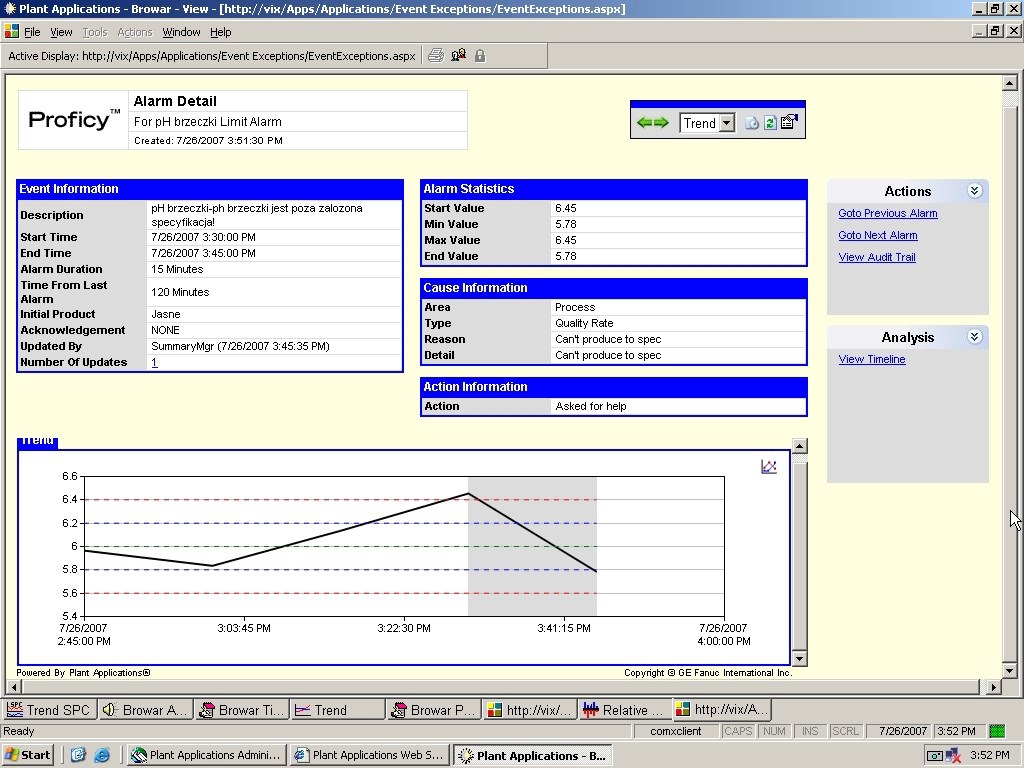
11. Detailed report for a given alarm. It presents such data as: duration, acknowledgment, area of occurrence, reason, actions taken, plots a variable waveform in an alarm state and many more.
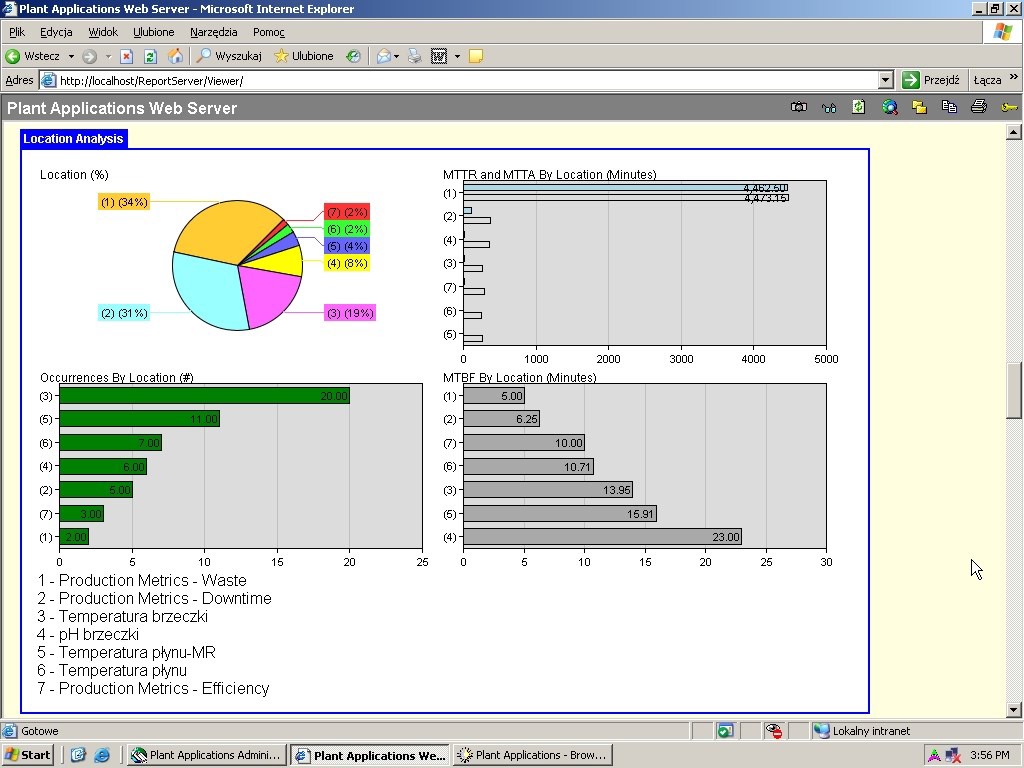
12. Report summarizes causes of alarms for a given machine by plotting pie charts and bar graphs of alarm distribution for given products, reasons for their occurrence, etc.
SPC
SPC capabilities in Plant Applications make it easy to define alarms based on SPC rules and present them as graphs. MES Plant Applications enables using calculated variables with seven preconfigured calculations (Average, Profile, P-Chart, U-Chart, Xbar-MR, Xbar-R and Xbar-S).
SPC enables preventing of defects occurrence by monitoring, controlling and reducing process variability by presenting data facilitating continuous process improvement.
SPC supports the analysis and decision-making thanks to the tools determining whether the process is stable and predictable (shift-by-shift, day-by-day etc.).
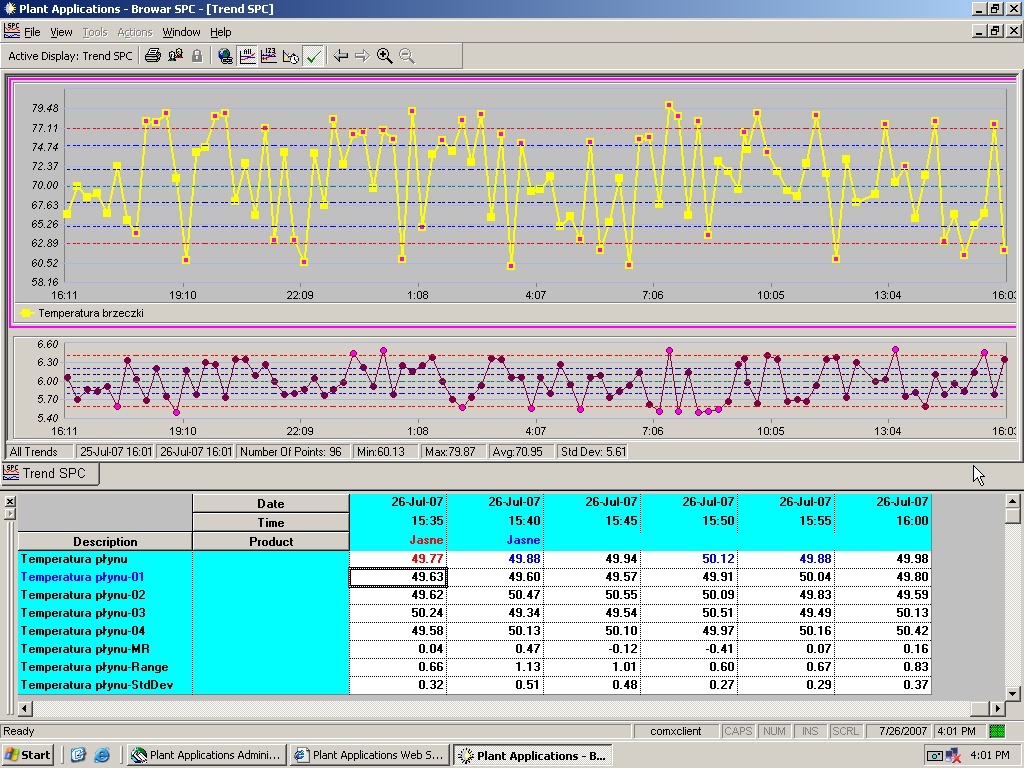
13. Screen from the client application, displaying statistical data, Xbar-MR Chart. Specification ranges are also displayed.
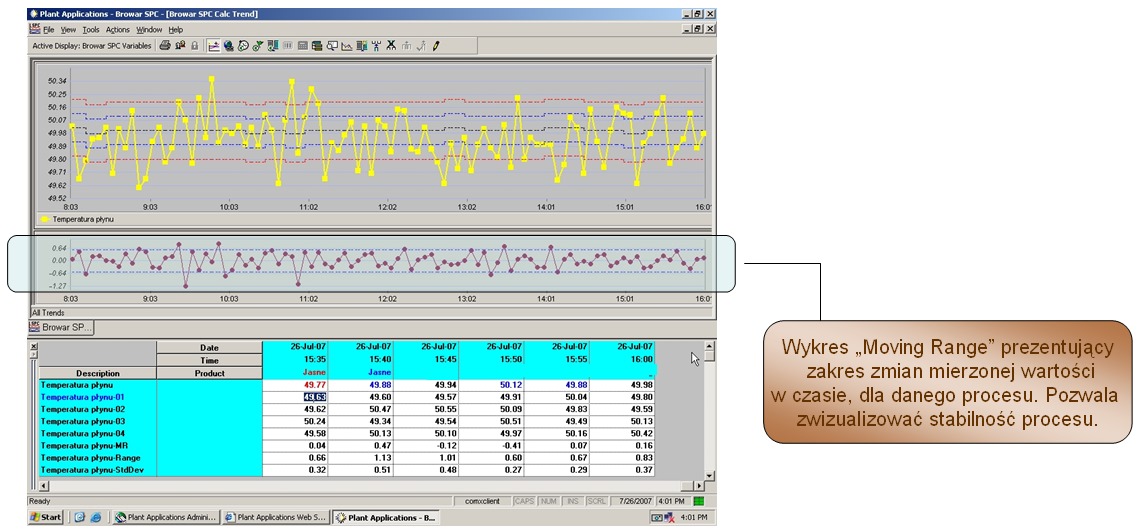
14. Screen from the client application, displaying statistical data, Xbar-MR Chart. Specification ranges are also displayed. Unlike the previous screen, the SPC alarms that have occurred in the process are also shown. Alarms can be viewed and edited / analyzed directly from the graph.
Enterprises should have complete process documentation of the production compliance with the assumed specifications. Comparative controls and process documentation should be displayed in the form of properly prepared reports. Compliance monitoring in Proficy Plant Appls should enable:
- Increasing the production compliance with specifications,
- Increasing the repeatability of production batches quality,
- Comparing batches to batches (the so-called “golden batch”)
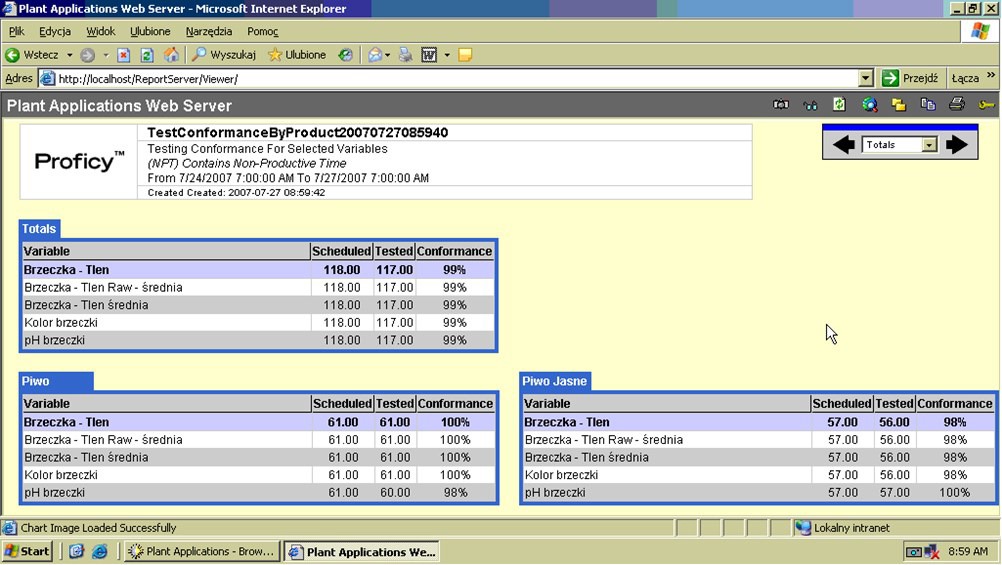
15. Compliance report of the number of tests performed with the number of tests planned to be performed for a given product.
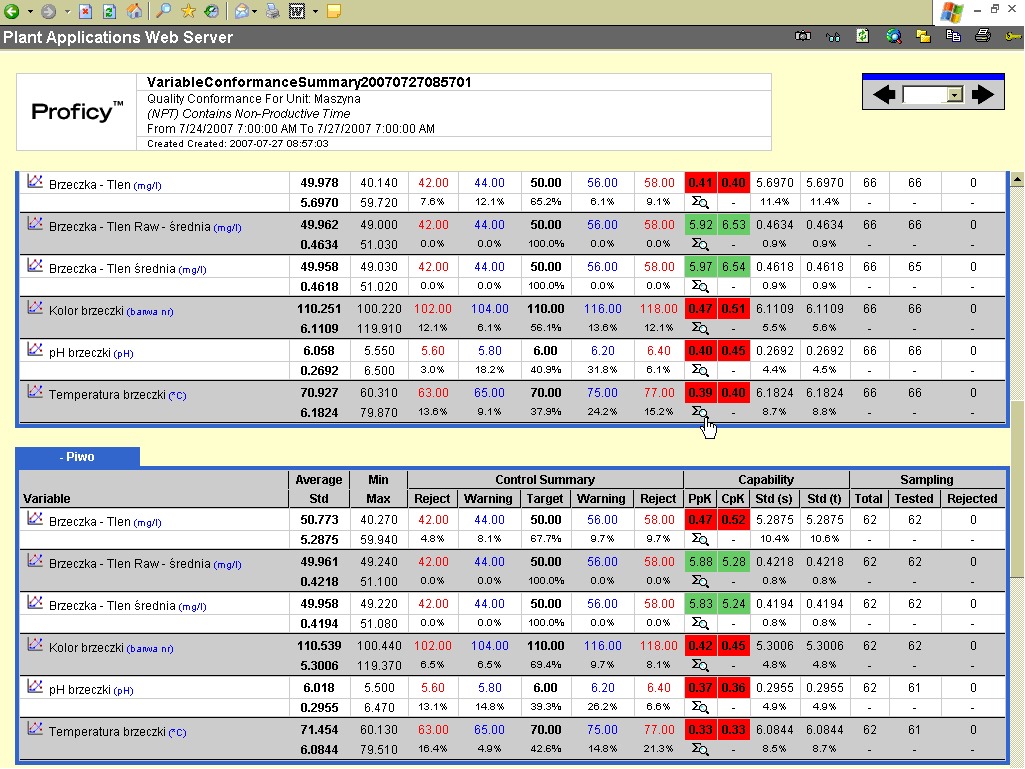
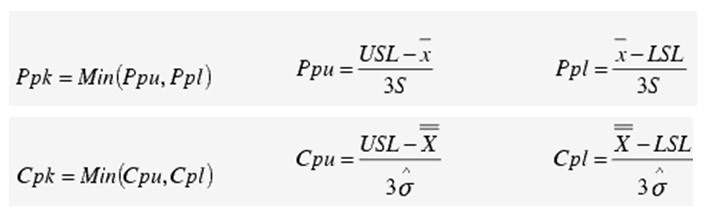
16. Report presenting a summary of all parameters determining the compliance of variable values with specifications. It also allows for automatic calculation of statistical coefficients: Ppk and Cpk.